

![]()
![]()
![]()
![]()
![]()
![]()
THERMAL INJECTION TESTING OF WATER WELLS
William M. Turner, Ph.D.
INTRODUCTION
In the analysis of aquifer-performance test data, it is desirable to know which part of the aquifer has the highest hydraulic conductivity and will yield water at the highest rate to a well. Many workers have tried to develop in-hole flow meters based on different principles. They all have drawbacks.
From the analysis of aquifer-performance-test data collected from an irrigation well and a number of observation wells located at the village of Carrizal in the Santa Elena Peninsula of Ecuador, AGW scientists suspected that, although 160 feet (49 m) of detrital material was reported in the driller's log, the part of the aquifer contributing water to the irrigation well was very thin. To gain additional information, a thermal injection test was performed using the irrigation well. The well is screened throughout the total thickness of the aquifer.
THEORY
If water, at a temperature different from the temperature of water in a well column, is introduced rapidly into the well bore, it displaces water in the well and forces it into the aquifer. For a well, screened throughout the aquifer, the part of the aquifer with the highest hydraulic conductivity will accept the greatest mass of water and will act as the strongest heat source or heat sink, depending on the temperature of the injected water relative to the natural temperature of the aquifer adjacent to the well. The part of the aquifer which requires the longest period of time to reestablish thermal equilibrium will be the zone of greatest hydraulic conductivity. Repeated temperature logging of the well following injection of the slug of water will reveal this zone easily.
THE TEST
|
|
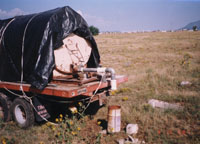 Typical Injection Setup.
RESULTS
Temperature profiles measured after injection showed that a zone, beginning at the water table and extending downward about 16 feet (5 m), required the longest period to cool. We interpret that this zone has the greatest hydraulic conductivity. The remaining 144 feet of alluvial material shown on the driller's log did not produce water.
The results of the thermal injection test confirmed the interpretation of the aquifer-performance test and identified that the part of the aquifer which contributed most water to the Carrizal well is very thin.
![]()
![]()
![]()
![]()
![]()
![]()
? 1999 - 2016 AGW Consultants. All Rights Reserved.